
Free · No sign-up · Any AP brand
Free Wi-Fi heatmap planner: plan your access points in 5 simple steps.
Upload your floor plan, follow the numbered steps and get an AP layout with a signal forecast. No training, no install, no account. Works with Cisco, Aruba, Ubiquiti, Ruckus and 16 more brands.
- 1Uploadyour floor plan and set the scale
- 2Setyour signal and client targets
- 3Chooseany brand, or let us recommend
- 4Drawwalls to match the building
- 5Calculateand export your AP layout
Floor-plan forecast
Upload a floor plan to begin.
Upload an office floor plan
The uploaded image will appear here. After calibration, the AP recommendations and signal forecast will be drawn over it.
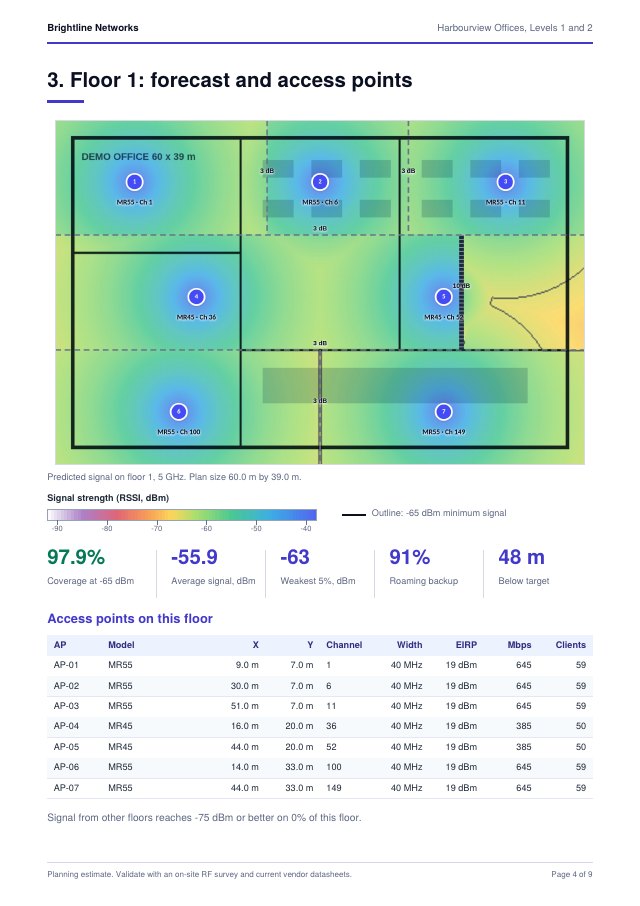
Estimated signal strength (RSSI, dBm)
Outline = your minimum RSSI
Recommendation summary
No design has been calculated.
Proposed AP locations
Coordinates are measured from the top-left of the floor plan.
| AP | Model | X position | Y position | Channel | EIRP |
|---|---|---|---|---|---|
| No recommendations available. | |||||
Recommended hardware
Compare the access points in your design from trusted suppliers.
Sponsor this tool
Reach network engineers and IT integrators with a direct-sold banner. See sponsorship options or email us for rates.
Advertise with usDeliver a design report your client can sign off on
Pro turns this planner into a deliverable. One click gives a branded, multi-floor PDF with your logo, a forecast map for every floor, AP schedules, equipment and capacity checks.
- Full multi-floor design report with a cover page
- Unlimited watermark-free PNG and PDF exports
- Multi-floor planning with signal between floors
- Your logo and company name, no Signal Plan watermark
- Save projects on your computer, and no ads
Pays for itself from the second clean export each month. Cancel any time in PayPal.
Wi-Fi heatmap planning FAQ
How many access points do I need?
It depends on coverage (walls, materials, target RSSI) and capacity (clients and throughput). Enter both, then compare the forecast with an on-site survey.
What RSSI should I design for?
Around -65 dBm suits voice and video; -67 dBm is a common enterprise data target; -70 dBm is basic coverage.
Is the Wi-Fi heatmap planner really free?
Yes. Planning, the forecast, the on-screen heatmap and a watermarked image export are free. A watermark-free HD export and PDF design report is a paid option.
Is my floor plan uploaded anywhere?
No. The floor plan is processed in your browser. Only planning numbers, such as floor size, band and chosen AP models, are sent to look up model data.
Which access point brands are supported?
Cisco Meraki, Cisco Catalyst, HPE Aruba Networking, Aruba Instant On, Ubiquiti UniFi, Ruckus, Juniper Mist, Extreme Networks, TP-Link Omada, Fortinet FortiAP, Huawei AirEngine, Zyxel, NETGEAR Insight, Cambium Networks, WatchGuard, Ruijie Reyee, Grandstream, MikroTik, D-Link Nuclias and generic models.
Where do the access point specs come from?
Each model carries its Wi-Fi generation, spatial streams on 2.4, 5 and 6 GHz, and antenna gain. Models marked with a tick were checked against the manufacturer's datasheet or spec page; models marked est. use the brand's family specification until we confirm that exact datasheet. From these the planner works out transmit power, throughput and client capacity for the band and channel width you choose. Always check the current datasheet before you buy.
Which propagation model does the planner use?
Signal Plan uses a COST-231 multi-wall (Motley-Keenan) model with a calibrated path-loss exponent. Predicted RSSI = EIRP - L1m - 10 x n x log10(d) - sum of wall losses x band factor - slab loss - link margin. L1m is the free-space loss at the 1 m reference distance (40.2, 47.1 and 48.7 dB at 2.4, 5 and 6 GHz), n is the path-loss exponent (1.9 for an open office up to 3.1 for high attenuation) and d is the 3-D slant distance from the ceiling access point to a client at 1.2 m. Every wall that the straight line from the access point to the point crosses adds its loss, scaled by 1.0, 1.2 and 1.35 at 2.4, 5 and 6 GHz. A fixed 8 dB link margin covers client antenna, body loss and fading. Multi-floor designs add a slab loss where each extra floor adds 60% of the first, a simplification of the COST-231 non-linear floor factor. The model is deterministic and downlink only, and it does not model multipath, diffraction or co-channel interference.
Which technical parameters and terms does the planner use?
EIRP is transmit power plus antenna gain. Each access point is balanced to a 15 dBm client plus the model's antenna gain, less 2 dB because datasheet gain is a peak value (the vendor's average-pattern gain is used where published). At 6 GHz EIRP is capped at the indoor low-power limit of 5 dBm per MHz and 30 dBm. RSSI is compared with a minimum target such as -65 dBm; the noise floor on a 20 MHz channel is about -95 dBm, so -65 dBm leaves roughly 30 dB of SNR. Throughput per access point comes from spatial streams, channel width, the highest modulation and coding scheme of the standard (802.11n, ac, ax or be), a MAC efficiency of 40 to 45 percent, and MU-MIMO counted as half a stream for each stream beyond two. Client capacity scales with Wi-Fi generation, band and streams. Roaming backup is the share of the floor where the second-strongest access point is at -72 dBm or better. Placement is a greedy search that maximizes a coverage utility over a sampled grid, with a spacing penalty so units do not cluster.
Can I upload a PDF floor plan?
Yes. Choose a PDF in step 1 and the planner draws one page to an image inside your browser. If the PDF has several pages you pick the page. The file is not uploaded. Set the scale afterwards, as with any plan.
How accurate is a predictive Wi-Fi heatmap?
It is a planning estimate based on distance, walls, band and the published datasheet specifications of the access points you choose. Real buildings differ, so validate it with an on-site survey before buying or installing equipment.
How the Wi-Fi heatmap planner works
- Upload and scale your floor plan. Add a PNG, JPG or WebP, then enter the floor size or mark a known dimension.
- Choose requirements and access points. Set the band, minimum RSSI, clients and Mbps, then pick a brand or let the tool recommend models and quantity.
- Draw walls and calculate. Mark glass, drywall, brick, concrete and lift cores, then review the signal forecast, AP locations and channels.
New to Wi-Fi design? Read our guides: how to plan access point placement and Wi-Fi signal strength (RSSI) explained. Planning with a specific vendor? See the Wi-Fi heatmap planner pages for Cisco, Aruba, Ubiquiti, Ruckus and 16 more brands.
Planning method
Preliminary predictive wireless design
The tool uses floor scale, AP profiles from each brand's published specifications (Wi-Fi generation, spatial streams and antenna gain), distance-based signal loss, selected wall attenuation, client demand, and target RSSI to create a preliminary placement forecast.
Mixed AP inventory
Place models from any supported brand together while maintaining the exact quantity entered for each model.
Flexible scale calibration
Enter the overall floor dimensions, mark a printed drawing dimension, or estimate scale from a standard office-chair width.
Editable recommendations
Move recommended APs, add wall attenuation, inspect predicted RSSI, and export the map and AP-location list.
This is a preliminary browser-based forecast. Validate current AP specifications,
regulatory domain, antenna behavior, channel width, mounting constraints,
PoE, cabling, roaming, and measured RF conditions before deployment.